
The data layer for AI & embedded analytics
Connect any data. Model it once. Power dashboards, analytics inside your product, AI chat and Claude from the same definitions. BI.P.EYE pulls every source into one data layer, defines business models, metrics and permissions in a semantic layer, and the AI reads that prepared, pre-aggregated layer, so the numbers are exact and every one of them is traceable.
Trusted by product and data teams






At companies across different industries
Every month, on dashboards, embeds and chat
Inside their own products, or as the base for all their data
One platform, from raw data to trusted answers
Connect any data, model it once, and use the same definitions everywhere: in dashboards, inside your product, in chat and in Claude.
Claude MCP server
Ask questions about your data directly in Claude.
Why did our revenue drop last month?Chat with your data
Insights, summaries and analysis in natural language.
What are our top products by revenue?Different sources, one unified data layer
No-code pipelines pull from each source, reshape the data, match records across systems, and store the result in the destination you choose. Authentication, pagination, rate limits, retries and nested JSON are handled for you.
customer_id matched across Shopify, Stripe and CRM
Pre-aggregated and indexed for fast queries. Stored in the destination you choose; private networks via AWS PrivateLink.
Data models that give your data business meaning
A BI.P.EYE model turns tables from different sources into business entities, the relationships between them, trusted metrics and access rules. Dashboards, embedded analytics, chat and Claude all read the same model.
- Customer places Order
1 : N - Campaign drives Order
1 : N - Order contains Product
N : N - Order returned as Return
1 : N
region = EUown rows onlyAsk questions about your company's data directly in Claude
The BI.P.EYE MCP server connects Claude to your models, relationships and semantic layer, so answers use the same definitions as your dashboards.
- Claude queries your BI.P.EYE models - it never connects to your databases directly
- Large results, like a 200k-row table, come back as a download link for Excel
- Performance, caching, security and query efficiency are handled on the BI.P.EYE side
Listed in the Claude connectors directory. Sign in with your BI.P.EYE account.
Net revenue fell 12% vs. the prior month. Most of the gap comes from two channels:
| Channel | Prior | Last month | Change |
|---|---|---|---|
| Paid social | $184k | $139k | -24% |
| $96k | $81k | -16% | |
| Organic | $212k | $214k | +1% |
AI Assistant for Your Data Live
Use the AI assistant to analyze your data. Embed it in your website or app so your customers can analyze their own data with AI. The assistant reads a prepared, pre-aggregated layer rather than raw tables, which is why the numbers it returns match your dashboards exactly.
Choose where your data,
layers and models
live.
BI.P.EYE runs the pipelines and writes your clean data, data layers and models to the destination you choose: your own Snowflake or Postgres, or an isolated BI.P.EYE warehouse that is yours alone. Keep it in your own warehouse, and you keep ownership of the storage, the access and the retention.
- 1Extractlatest file or whole bucket
- 2Transform & modelclean, join, type
- 3Writeupsert or fresh write
- 4Scheduleevery 10 min, or yours
Never shared with other customers. Connect privately over AWS PrivateLink.
Your warehouse, your rules
Results are written to your own Snowflake or Postgres, next to the rest of your stack. You decide who can access it and how long it is kept.
A dedicated destination
Prefer us to host it? Run on an isolated warehouse, with your workloads and data separate from everyone else.
Private connections
Connect over AWS PrivateLink with no public endpoints. Data is encrypted in transit and at rest.
- Terabytes of Parquet in S3?
- Yes.CSV, JSON and Excel too.
- Load it all into Snowflake?
- Yes.Or into your own Postgres.
- Latest file or the whole bucket?
- Your choice.
- Upsert or fresh write?
- Both supported.
- Refresh every 10 minutes?
- Yes.Or on any schedule you set.
- A ready-made MongoDB connector?
- Yes.Pick a collection, no code.
Everything below is designed to cut analysis time
Connect, transform, visualize, and share. No code required. Built for speed and scale.
No-code pipelines
Create data pipelines with no code. Join, filter, and transform with clicks.
No-code charts
Build beautiful charts in minutes. Share or embed anywhere.
AI assistants
LiveAsk questions in plain language. Get queries and insights instantly.
Chat with your data
Natural language to SQL. Explain results. Iterate quickly.
Smart recommendations
BetaGet suggestions for better visualizations based on your dataset.
Embed dashboards
Add dashboards to your app or website with a secure token.
Brand customization
Match fonts, colors, and layout to your product.
Scheduled jobs
Automate refresh with monitoring and progress tracking.
Permissions and caching
API keys, permissions and caching for fast, secure access.
Business intelligence, all in one platform
Most teams stitch together four tools: one to extract data, one to model it, one to visualize it, and one to embed the result. BI.P.EYE covers that whole chain. Data lands from your sources, moves through no-code transformations, gets pre-aggregated, and is served to dashboards, an AI assistant, or an iframe in your own product. Every step runs on a schedule you control, with progress tracking and alerts when a job fails.
Give your customers dashboards they'd pay for
Analytics is the feature your customers keep asking for and your roadmap keeps postponing. Drop BI.P.EYE dashboards straight into your product, in your branding, with every customer seeing only their own data. Weeks of work instead of quarters, and nothing to maintain.
Turn your product into a data product
Your customers stop exporting CSVs and start logging in more often. You ship a premium feature without hiring a data team.
- • Interactive dashboards, not static reports
- • Every customer sees only their own rows
- • Your fonts, your colors, your product
- • Live data, no exports, no stale numbers
Build the dashboard
Connect your data and design the dashboard with no code, the same way you would for your own team.
Decide who sees what
Set permissions per customer and per dataset, so each account is limited to its own rows automatically.
Drop it into your app
Paste one line into your product and it's live. Your engineers keep their sprint, your customers get analytics.
Generate signed, row-level-secured dashboard links from your own backend, set expiry per link, and revoke access instantly. Everything is documented in the OpenAPI reference.
Custom API integrations
The API connector collects data from any HTTP API. Pagination, auth, retries and nested payloads are handled for you.
Any API in. Clean, queryable data out.
Security is an architectural principle, not a checklist
Every change to the platform starts with one question: how could this be abused? Before we think about performance, UX or scale, we ask who should have access, how sensitive information moves, and whether the change weakens an existing control or opens a new attack vector. That applies to code, to infrastructure and to internal process, from day one and for as long as the product exists.
Connect your databases without exposing them
Connect your AWS databases and internal APIs over AWS PrivateLink. It creates a fully private connection between your AWS environment and ours, so your data never crosses the public internet, even across accounts and regions.
- No public database endpoints
- No inbound firewall rules for our static IPs
- No internet exposure
- Private VPC-to-VPC traffic, across AWS accounts and regions
Your database stays in your account, under your control. We connect to it, we don't take custody of it.
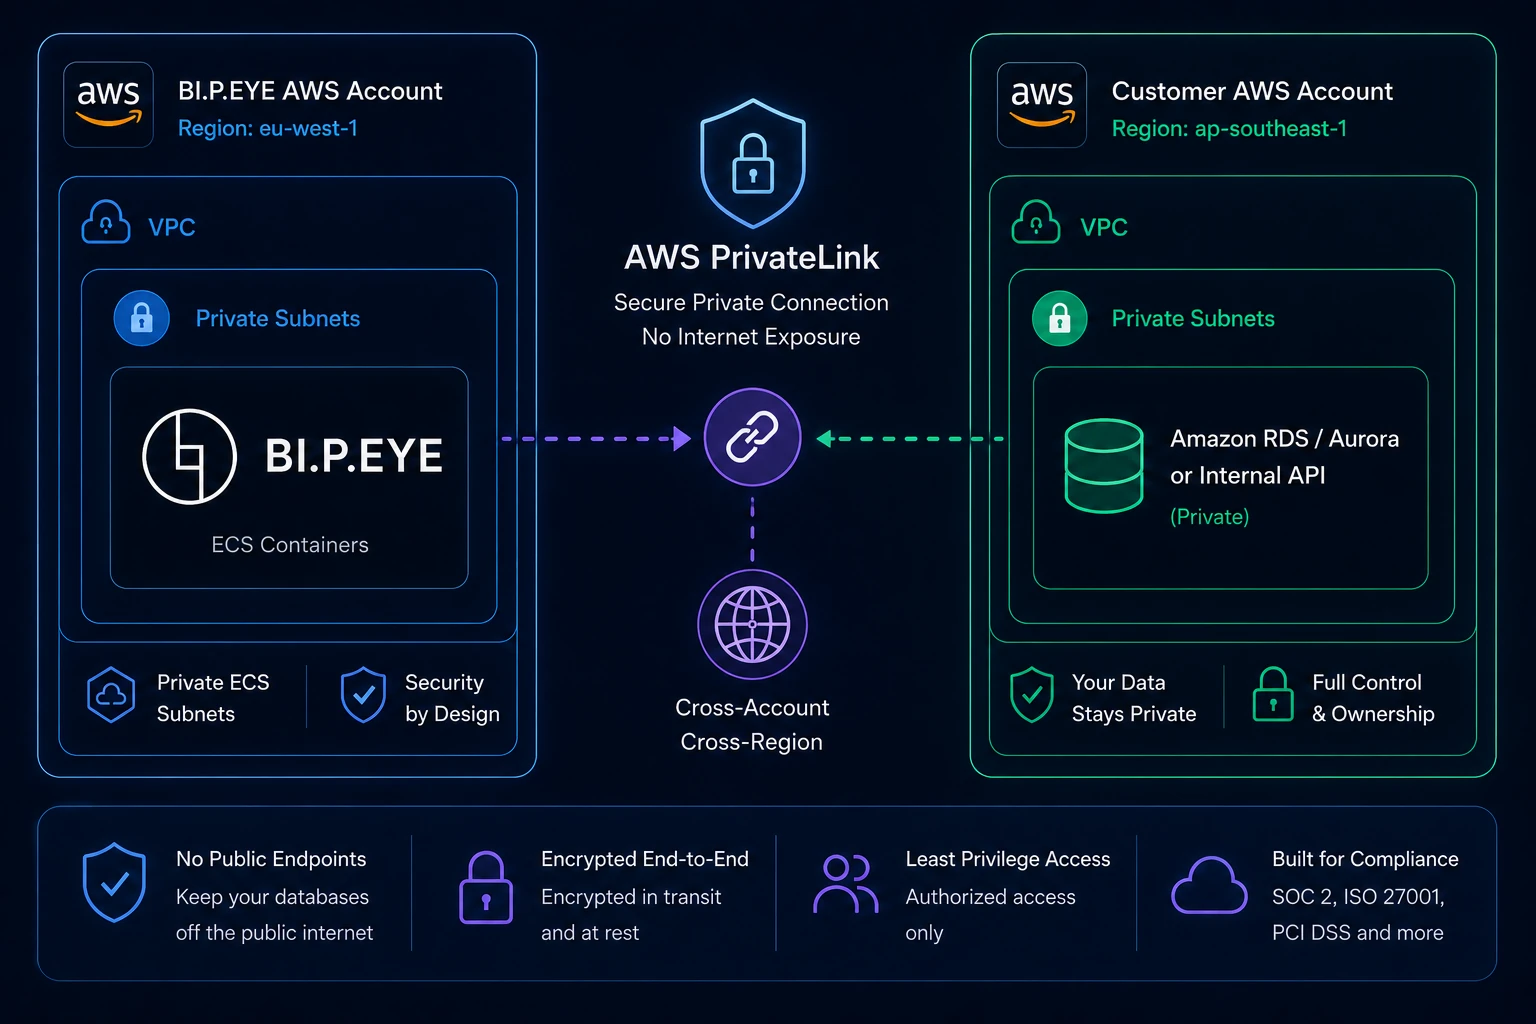
Keep your databases off the public internet entirely.
All data encrypted in transit and at rest.
Authorized access only, scoped per user, key and dataset.
Certified under ESOF AppSec ADA CASA, benchmarked against OWASP ASVS, and built to support SOC 2, ISO 27001 and PCI DSS programs.
Have a security review, a questionnaire or an architecture question? Email [email protected] and we will walk your team through it.
Test the full product in your own free trial
A step-by-step guide with a sample file of 1,000 Shopify orders. Run a pipeline, build a model, ask questions in a dashboard and in Claude, and see how embedding works. 30 days, full access, no credit card.
-
1
Add your data
Upload a CSV or JSON file, or connect your app, database or warehouse.
-
2
Run the pipeline
Flatten, filter and select columns without code. Schedule it and write to your own warehouse.
-
3
Build a model
Connect datasets with relationships. One semantic layer for every dashboard and AI answer.
-
4
Ask, then embed
Chat with a dashboard or ask in Claude, then put the dashboard inside your product.
Start free. Scale when ready
Create an account and connect your first datasource without a credit card. Pricing is usage based, so a small project stays small on the bill. When your data volume grows, or you move dashboards into your own product, you move up a tier. If you need an isolated warehouse or a dedicated integration, email us and we will price it directly.
From the blog
Notes on building trustworthy analytics, written by the people who build the pipelines. We publish what we learn from real data problems: where numbers drift, why two dashboards disagree, and what to check first.
How to Build a Data Workflow Across Multiple Sources
Orders in one database, ad spend in another, tickets in a third. Collecting the data is the easy part. Making it agree is the work.
Read article →
Why Your Shopify Store Analytics Might Be Misleading
Draft orders, parallel returns, and app after app quietly rewriting your data. Here is how to get to one number you can actually believe.
Read article →Tell us your data problem. We'll solve it with you.
From a single Shopify store to a company running on twenty tools, we turn scattered data into decisions you can act on. Start with the case closest to yours, or send us the one that isn't here.
Find out where your store is losing money
Revenue looks fine, profit doesn't? The answer is hiding in returns, refunds, discounts and shipping. BI.P.EYE puts them all in one view so the leak stops being a mystery.
- • Return and refund rate by product, variant and reason
- • Connect carrier data: real shipping cost vs what you charge
- • Trends and hidden insights, surfaced before the season ends
One number the whole company agrees on
When every department brings its own spreadsheet, the meeting is about whose number is right, not what to do. Put everyone on one platform that syncs in real time, and challenge your data team and management layers with real data.
- • CRM, finance and ops in one executive dashboard
- • A single source of truth, refreshed on your schedule
- • Built for mobile: your KPIs in your pocket, not in a deck
Know which campaigns actually pay
Ad platforms grade their own homework. Pull spend, traffic and revenue into one place and see blended performance per channel, campaign and audience, without exporting a single CSV.
- • Google Analytics, ad APIs and sales data joined automatically
- • Spend next to revenue, not in separate tabs
- • Ask the AI: "which campaign drove repeat customers?"
Make your CMS and internal systems measurable
The most important data in your company often lives in tools nobody can report on: a CMS, an ERP, a homegrown admin panel. If it has a database or an API, BI.P.EYE can read it, model it and chart it.
- • Any REST API, SQL or MongoDB database, or files in S3, no custom code
- • Join internal data with Shopify, Stripe, sheets and more
- • Scheduled refresh with alerts when a job fails
Surface the insights hiding in your systems
You can't ask a question you didn't think of. BI.P.EYE's AI agents read your prepared, pre-aggregated data and point at the things worth a second look: the segment that's quietly growing, the metric that drifted, the pattern nobody was watching.
- • Insights on demand, in plain language
- • Exact numbers: the AI reads a clean layer, not raw rows
- • From "interesting" to a shared dashboard in minutes
Ship analytics your clients will pay for
"Can we get a dashboard?" is your customers telling you what to build next. Embed interactive dashboards for sales, reports, usage and trends inside your product, in days instead of a quarter of engineering time.
- • Row-level security: every client sees only their own rows
- • Your fonts, your colors, your brand, our engine
- • Iframe in minutes or a full Embed API from your backend
Don't see your use case? There are no limits here.
Ten orders a day or ten million rows an hour, one datasource or thirty: if your data lives somewhere, we can connect it, model it and put it to work. Tell us the problem, and we'll move fast, with numbers you can trust.
Watch our capabilities and demos
Screenshots can be staged. These are short, real recordings of the platform doing the work: modeling databases, building pipelines, turning questions into SQL and charts. Every demo is under 90 seconds, so pick the one closest to your problem and press play.
Synthetic AI Layer, in one click
AI agents don't just need access to your data, they need to understand it. Watch AI map your business entities, metrics, dimensions and relationships automatically.
Chart Workflow
Every chart gets its own visual data pipeline, even over nested JSON. Built for analysts and business users who don't want to touch datasets, semantic models or SQL.
Pipeline dependencies
Drag and drop to define ETL dependencies, control execution order between datasets and configure schedules in seconds. Your entire data workflow, at a glance.
Suggested data modeling
Hundreds of tables, thousands of relationships, years of growth. Watch BI.P.EYE make sense of a massive database in minutes, not months.
The Playground
AI analytics isn't about getting an answer, it's about trusting it. Upload a file, drill down, change aggregations and validate every number, no signup required.
ETL Data Workflow
Collecting data from APIs and taming nested JSON is still painful for most teams. This is the workflow that makes it dramatically simpler.
Chat with your data
Ask a question in plain language and get an answer, chart or table back in seconds.
Chat to SQL
Questions in any language become complex SQL in seconds, powered by the semantic layer and dataset relationships. Review, edit and run.
Embedded AI agent
A fully self-serve experience: your customers interact with an intelligent assistant directly inside your product interface.
Want a walkthrough on your own data instead of ours? Email [email protected] and we'll set one up.
Frequently asked questions
Can I ask questions about my company's data in Claude?
Yes. The BI.P.EYE MCP server connects Claude to your BI.P.EYE models, relationships and semantic layer. Claude queries the models, never your databases directly, and large results come back as a download link. Performance, caching, security and query efficiency are handled by BI.P.EYE. Add it from the Claude connectors directory, or follow the setup guide.
What is the semantic layer in BI.P.EYE?
A BI.P.EYE model maps tables from different sources to business entities such as customers, orders and products, defines the relationships between them, the metrics such as net revenue or return rate, and the access rules for each team or embedded customer. Dashboards, embedded analytics, chat and Claude all read the same model, so the numbers match everywhere. See an example model.
Which datasources does BI.P.EYE support?
BI.P.EYE connects to a wide range of sources, and we add more all the time:
- Databases and warehouses: Postgres, MySQL, SQL Server (MSSQL), MongoDB, Snowflake, BigQuery, Redshift
- Files in Amazon S3: CSV, JSON, Excel and Parquet
- eCommerce and SaaS: Shopify, Stripe, Deel, Bubble, Mixpanel, SkuSavvy, currencyapi.com
- Google: Analytics, Drive, Sheets
- Cloud: AWS
- Any REST or HTTP API: pagination, authentication, rate limits, dependent requests, failure recovery and nested JSON are handled for you
Don't see your source? We build dedicated integrations on request. Reach out at [email protected].
Can I embed dashboards in my product?
Yes, in two ways. For a quick setup, generate a dedicated API key in the dashboard and drop our iframe snippet into your product. For full control, use the Embed API to generate signed embed links from your backend.
Access is protected by several permission layers. You can scope per user and per end-user, by API key, by IP address, by allowed domain, and by dataset-level rules. Each API key can also carry per-dataset row-level filters, so every customer sees only their own rows.
How does AI help?
You can chat with your data, generate queries, get chart recommendations, and ask for explanations. Under the hood we run specialized agents. They collect data from APIs, write and fix SQL, analyze database structures, improve ETL pipelines, build dashboards and surface insights. We keep adding more, so the AI helps across the whole workflow, not just at the chat box.
Why not just send my data to an LLM and get answers?
It comes down to money, performance and security. You cannot hand a language model millions of rows for every question. It is slow, and the bill climbs with each query. Shipping raw data to a third-party model is also a security and privacy risk. Models tend to make mistakes when they compute over raw data on the fly.
BI.P.EYE does the hard work before you ask. Your data is collected, validated, structured and pre-aggregated by a real BI engine. The AI then sits on top of that clean layer. You get exact numbers, answers in seconds, and a fraction of the cost, without exposing raw data to the model.
What about security?
We take the security of your data seriously. All data is encrypted in transit and at rest. Our infrastructure runs on trusted providers: AWS, MongoDB and Cloudflare.
Our application security practices are certified under ESOF AppSec ADA CASA, an independent assessment by TAC Security. CASA is benchmarked against the OWASP Application Security Verification Standard (ASVS), the most widely adopted standard for application security requirements, and tests controls across fourteen categories including authentication, session management, access control and cryptography. The framework requires annual re-assessment, so it reflects the platform as it is today, not as it was at launch. We monitor, update and improve our systems continuously.
Can I connect my database without exposing it to the internet?
Yes. You can connect AWS databases and internal APIs over AWS PrivateLink, which creates a fully private connection between your AWS environment and ours. That means no public database endpoints, no inbound firewall rules for our static IPs, no internet exposure, and private VPC-to-VPC traffic even across AWS accounts and regions. See the security architecture for the full picture.
Can you build a full BI project for us?
Yes. Beyond the self-serve platform, our team can design and build a complete BI project for you: data modeling, pipelines, dashboards and embedded analytics. Reach out at [email protected] to scope it.
Where does my transformed data land?
You choose the destination. ETL results can be written to the BI.P.EYE warehouse or to your own Postgres or Snowflake warehouse, so your clean, transformed data lives where the rest of your stack can use it.
How granular are permissions?
Very. You can scope access per user and per end-user. You can lock embedded access down by API key, IP address and allowed domain, on top of dataset-level rules. Every consumer only sees what they should.
Can you add an integration that isn't listed?
Yes. Our API connector already covers most HTTP APIs. If you need a dedicated integration built, talk to us at [email protected] and we will add it.
Can my data run in an isolated warehouse?
Yes. You can run on an isolated warehouse for faster queries and stronger data isolation, keeping your workloads and data separate from everything else.
How fast is support?
Fast. Typical response time is a few hours at most. You can reach us at [email protected] any time.
Do you take feature requests?
Always. We build quickly and we like feedback. Tell us what you need at [email protected]. It shapes the roadmap.
Still have a question? Email [email protected] and we will get back to you within a few hours.
Contact
Questions about the platform, embedded analytics, or a custom BI project? Email [email protected]. We reply within a few hours on business days. You can also reach the team on LinkedIn.